Pi Charts
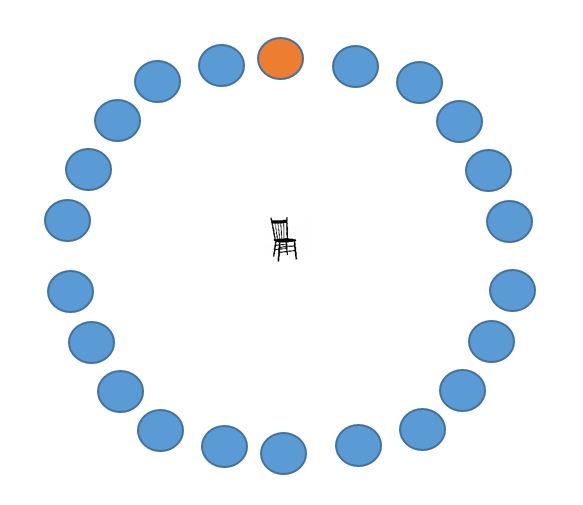
Give each student a large cut-out circle. Have students stand in a circle, and place their circle at their feet (so they each have a ‘spot’). Mark a starting point with a special colored circle that is different from all the others. Also, place a larger object (such as a chair) at the center of the circle.
At this point, your room might look like this:
At this point, your room might look like this:
Now, ask a question such as “Do you have a pet” Students who can answer yes to the question, rearrange themselves starting at the beginning circle and filling in seats clockwise. Students who answer NO will fill in the remaining seats.
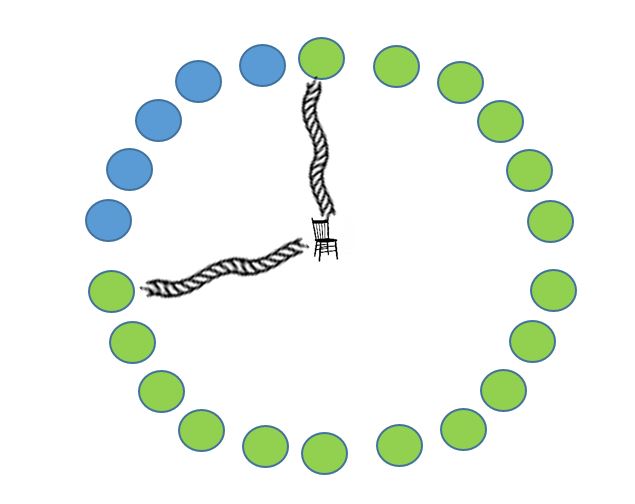
In this picture, students who can answer YES to the question are marked in green. The first and last person who can answer YES to the question get the end of the rope – the rope is strung through the middle of the chair. They have now created a personal Pie Chart.
Now…have students suggest questions that will lead to certain results… for example:
- Have students STATE the fraction of students who can answer YES to the question
- Have students ESTIMATE the percent of students who can answer YES to the question
- Have students JUSTIFY their answers
- Do you have brown hair?
- Do you have a sibling?
- Did you have cereal for breakfast this morning?
Now…have students suggest questions that will lead to certain results… for example:
- What questions could we ask that would have 100% of the students agree?
- What questions could we ask that would have 50% of the students agree?
- What questions could we ask that would have 0% of the students agree?
